TexanTurnout
Predicting Voter Turnout Rates in Texas Elections
Every election is determined by the people who show up.
Trying to Flip a Vote?
You'll need to know who is most likely to turn up at the polls. Any sort of election prediction analysis requires an estimate of the fraction of registered voters who will actually go to the polls and cast a vote — i.e., the voter turnout rate. This voter fraction, calibrated with registration statistics and pre-election polling figures, provides political campaigns and politically-minded organizations with a probable result of future elections, and how close any given race will be. They can then determine how to best allocate time and funding, where get-out-the-vote campaigns are most needed (or not necessary), and set the overall communication strategy with their members.
Traditionally, determining how many people will actually vote is done with pre-election polling. However, direct polling is expensive and slow, and prone to a slew of random and systematic errors. The efficacy of direct phone-based polling has plummeted thanks to the proliferation of cell phones and caller-id. Instead, predicting expected voter turnout rates from pre-existing, and mostly public, data represents a far more accurate and efficient approach.
As a fellow at the Insight Data Science Program in the Fall of 2017, I partnered with Value Voting to improve their prediction model for future voter turnout rates. Value Voting works with a variety of progressive, Texas-based organizations to advise where coordinated outreach campaigns will be most effective. By cross-referencing a group's member list with upcoming election figures, Value Vote identifies the districts in which an organization has significant political sway via an interactive user-friendly dash board. Value Voting delivers processed member lists that quantify individual members voting 'power', a metric of how likely someone is to vote, which organizations use to develop microtargeted communication strategies and maximize the impact of their resources. While the examples in this analysis are Texas-based, this approach can be applied to any of the 50 states.
With one week to improve Value Voting's voter turnout prediction methodology, I used individual demographics and past election records to deliver a model with a 7 percent increase in voter prediction accuracy. While doing so, I also identified some major confounding factors that limit the accuracy of these approaches to predict future election turnout and how these elements may influence any given election.
The Data
Value Voting supplied me with the 2016 voter registration role for the state of Texas, which includes the voter registration details for 14+ million Texans. Importantly, the data also included past election participation, for general & presidential (2008, 2012, 2016, etc.), midterm (2010, 2012, etc.) and primary elections. While voter registration, name, address, and past participation is publicly available, the dataset also included a number of externally sourced & engineered features, such as cell phone number, number of people in household, race, and gender.
I was additionally provided with a high-level summary of every past Texas election (Federal, State, & primaries), which included winner votes, runner-up votes, and total number of candidates running. For Texas State House and Senate primary races, I supplemented this election summary with other publicly available data, such as the total funds spent by various candidates.
I started by looking for high-level insights that would indicate any potential demographic patterns, a straightforward comparison of trends between overall voter turnout rate and demographic groups. For example, analyzing the overall voter turnout by age group produces this plot:
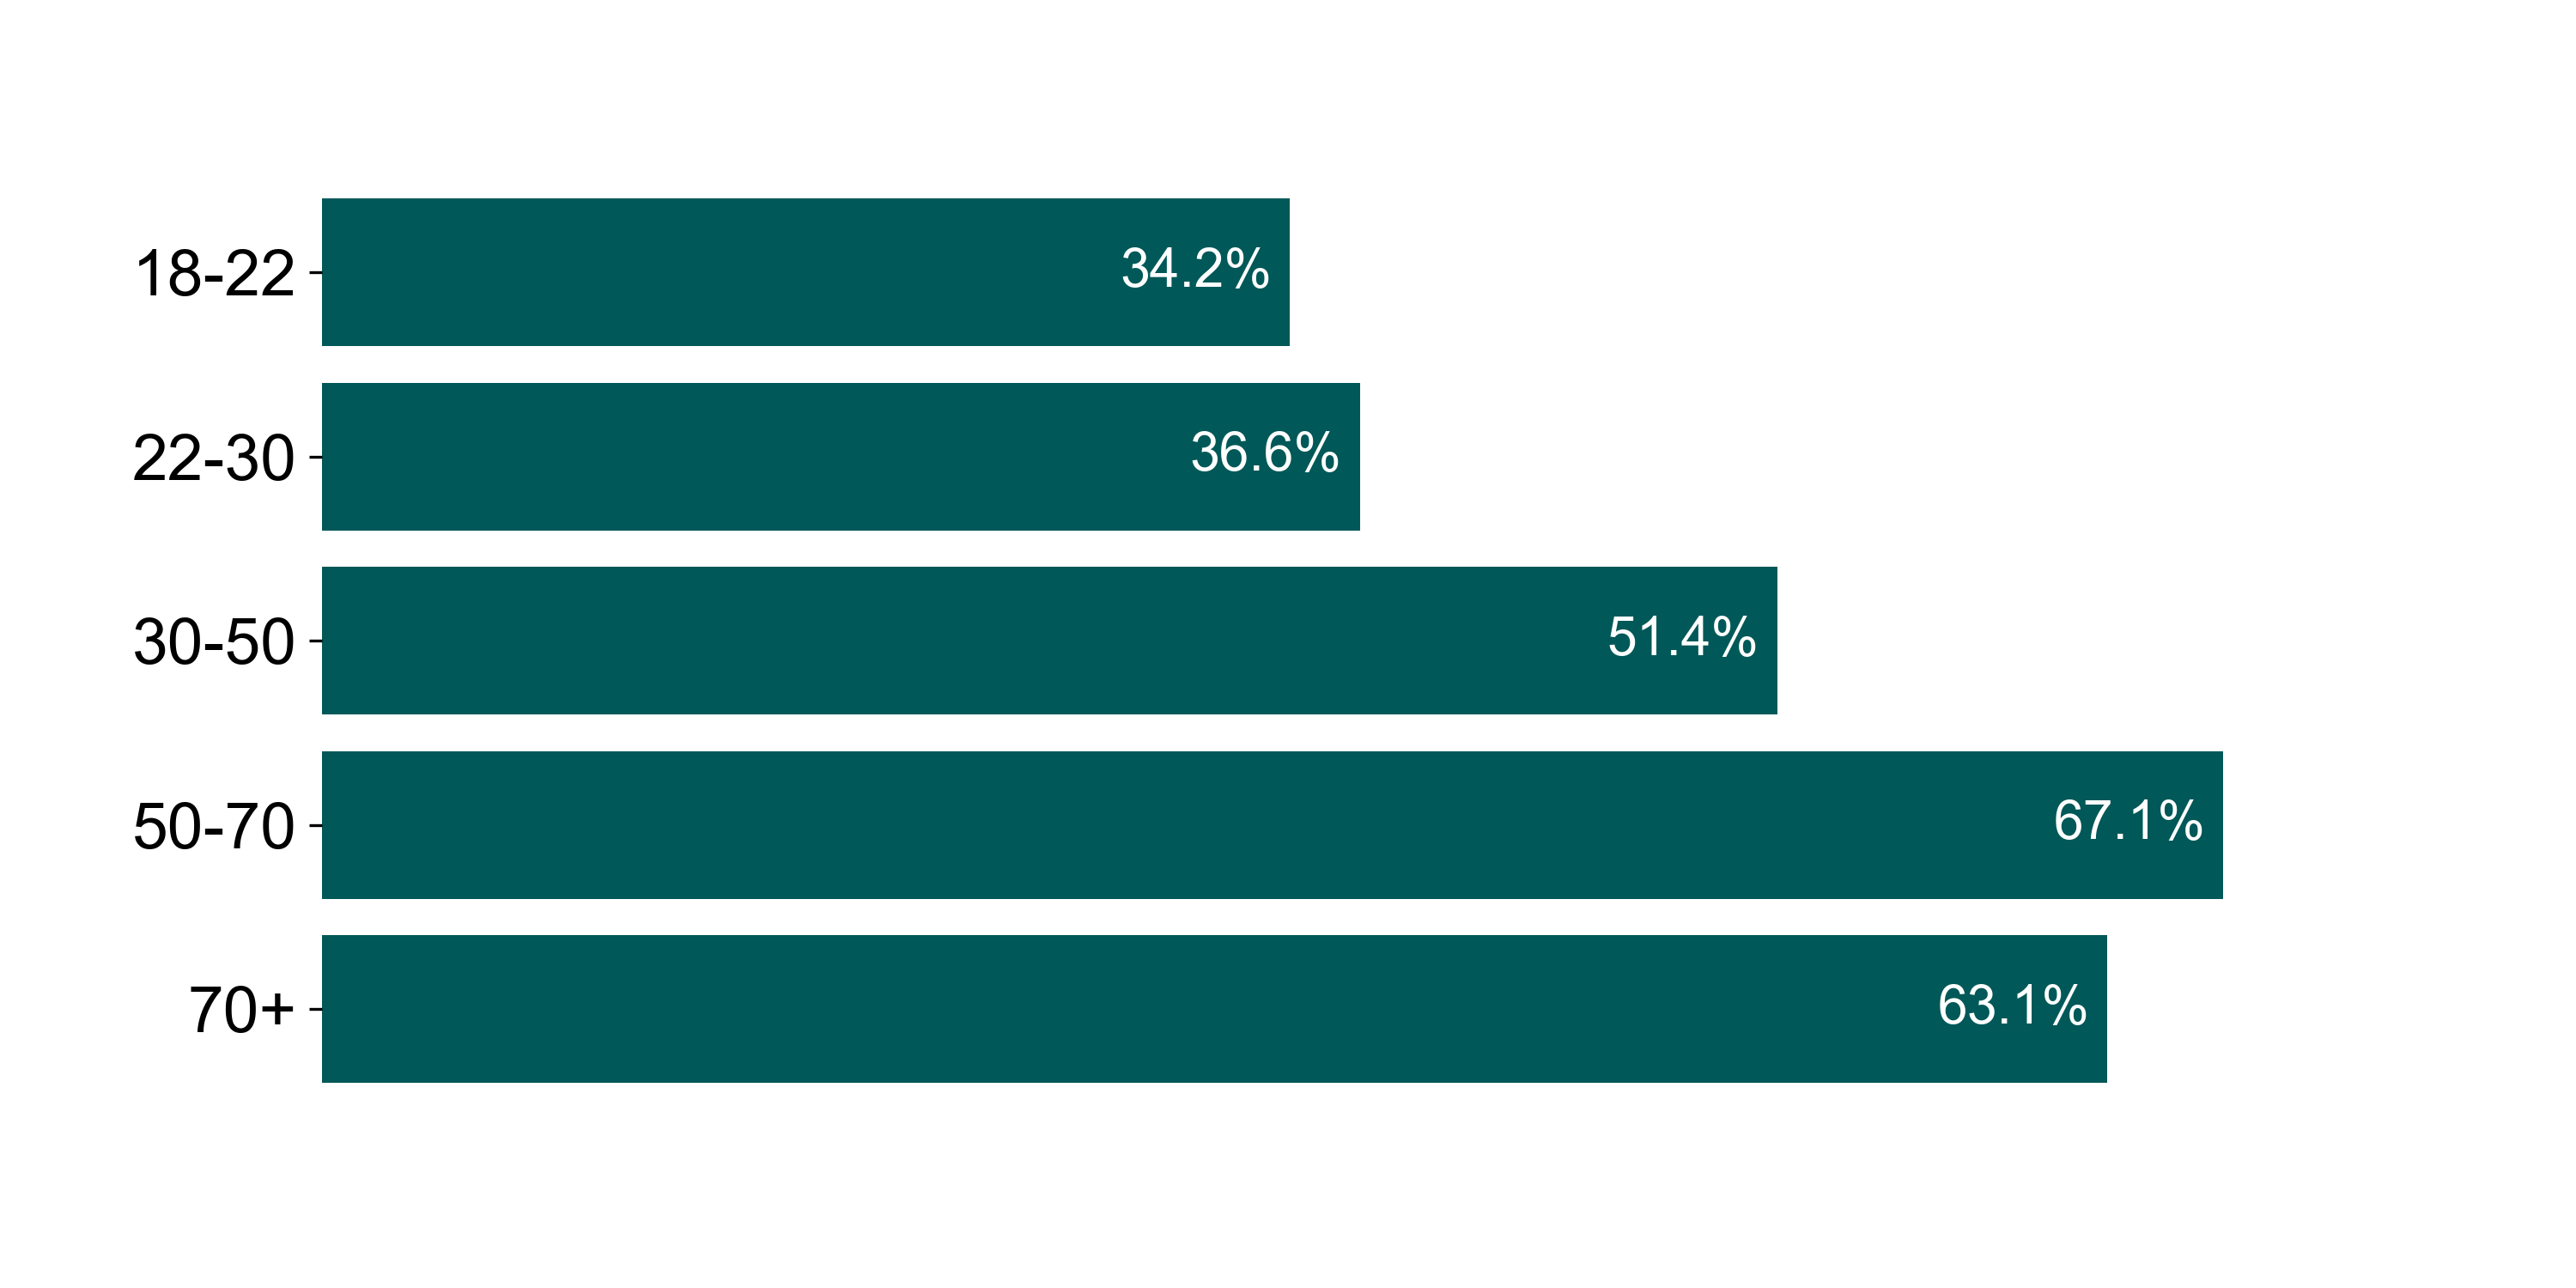
The data confirms a general assumption that people above age 30 are more likely to vote than those under 30, though the trend begins to reverse at age 70.
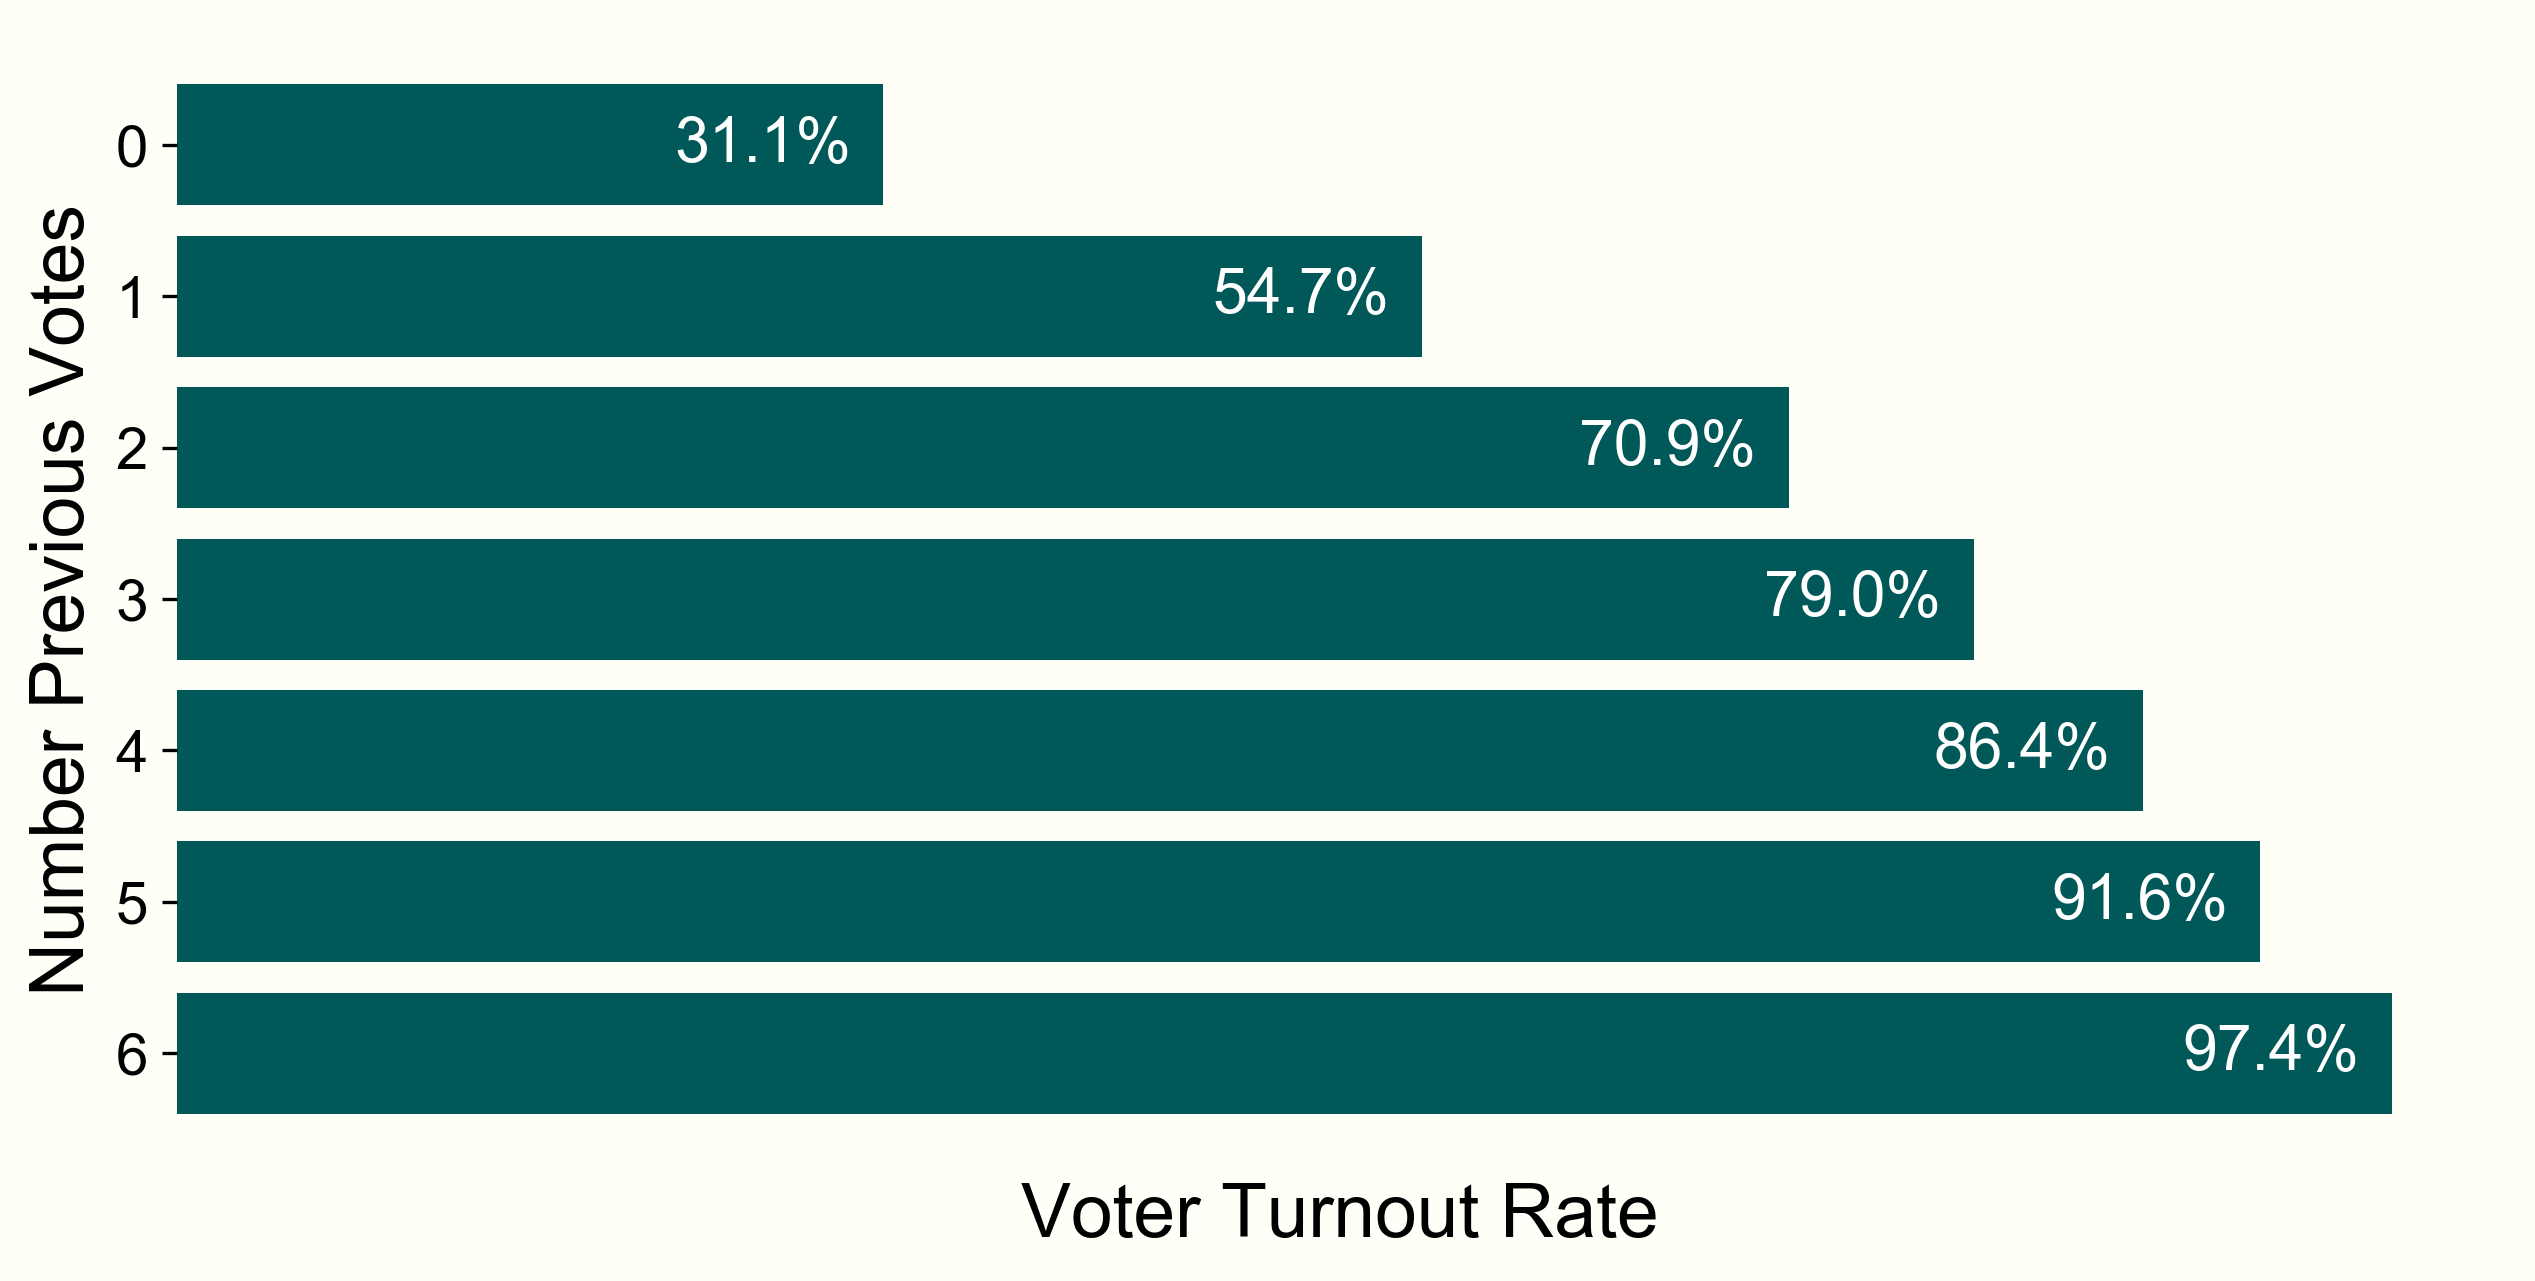
Voting history is also a strong indicator of future voting turnout patterns - people who voted in the past will likely do so again. Here, voter turnout rate is segmented based on the number of previous elections (since 2000) someone has participated in. This also conflates age with turnout rate, though — the older someone is, the more elections they will have been able to vote in. Someone born after 1986, on the other hand, has only been able to vote in 3 presidential elections.
While analyzing the data, it became clear that different districts (Federal and State) display a wide variation in voter turnout rate. This could be due to a number of reasons - local enthusiasm for a given election, socioeconomic status, ethnic group identity, access to voting locations, etc. Since Value Voting is primarily interested in the voter turnout rate within individual districts, and I didn't have immediate access to this supplementary data, it made sense to separate this analysis by district, rather than combining them all into a single model.
Individual Voter Analysis
For my first approach to this problem, I focused on voter demographics. Here, I treat individual voters as the datapoints, and I classify whether or not they will vote or not in a future election by their demographic features (age, gender, party affiliation) and past voting history.
While this is a relatively straightforward binary classification problem, the main challenge lies in how to compress a person’s potentially complex voting history (including state and presidential primaries, and general elections) down to one or a few meaningful quantitative features. I experimented with a number of approaches:
- Last1: Did a person vote in the previous election?
- LastX: Of the last X votes, how many did they vote in?
- Voting fraction: of the number of elections in which someone has been eligible to vote, what fraction did they go to the polls?
- Voting fraction + tscore: Here tscore is a quantitive value between 0 and 1 which expresses how recently someone has voted For example if someone voted in 2014, but not in 2016, their voting fraction would be 0.5, but with a tscore of 0. The reverse -- voted 2016, not 2014 -- would result in a tscore of 1.
- Individual binary 0 & 1 labels for each type of election and how many election cycles have occurred since.
It turns out there is not too much difference between these approaches: all voting history features produce accuracies within 5% of each other. Overall, however, I find that LastX with X=2 to produces the best classification rates and has the advantage of being relatively simple to understand and compute. Specifically, Last2 is the number of votes in the last two similar elections (midterm, primary, presidential) compared with the target variable.
For the classification, I began with logistic regression. It is fast to train, and highly interpretable. This dataset has many, many more samples than it does features (and potential combination of features), and thus the particular choice of algorithm did not significantly matter --- other more complex classification algorithms (random forest, SVM, etc.) all resulted in similar accuracy.
Here I focus on the prediction of Federal House races, though in principle this methodology would apply to any election; I train the model on whether or not someone voted in 2012 based on their past election activity. For validation, I tested both on held-out 2012 data for use in tuning the model and on 'unseen' 2016 election data to gauge how well the model performs when working to predict future results. Because past voting activity is such a good indicator of future activity, this approach is fairly accurate in predicting voter turnout. Overall, this model achieves accuracies of 78% for 2012 data, and 70% for the 2016 figures If I restrict my data to people with earlier voter registration dates, such that they have the opportunity to have a full Last2 score, the model accuracy jumps by nearly 10% ; the F1 score, representing the harmonic mean of precision and recall, is 0.81.
Along with a no vote/vote classification, logistic regression also supplies the confidence, in the form of a probability, of its prediction. The probability that someone is going to vote turns out to be an extremely useful metric for Value Voting and its customers since it enables microtargeting: a deliberate focus on individual people or groups by political organizations based on their expected vote or propensity to visit the polls. For example, some organizations may wish to only reach out to those who are almost certain to vote in a forthcoming election, while other outreach campaigns hope to target those on the fence about voting in an effort to increase turnout. By classifying ‘likely voters’ as those with a probability of voting (PV) of PV > 0.9, and ‘on the fence’ voters as those with 0.3 < PV < 0.6, this model identifies the average characteristic of these two groups:
Likely voters:
- Average age of 60
- 88% registered Democrats and Republicans
- Have voted in an average of 84% of elections for which they were eligible
On-the-fence voters:
- Average age of 43
- 66% unaffiliated with a political party
- Have only voted an average of 0.6 times
My goal here was to produce a more accurate model than Value Voting's current working model for the voter turnout rate (in which the voter turnout rate does not change). Since the previous turnout rate effectively already encapsulates demographic information and voting history information, a demographics based approach represents a negligible improvement with respect predicting the overall voter turnout rate. So I attacked the problem from a different anglge.
Election-Based Approach
To combat the limitations of the demographic-based plan, I experimented with alternative approaches based on broader, election-based characteristics to see if there were certain features that could be used to build a predictive model for future voter turnout rates. Using the corpus of 2012, 2014, and 2016 Texas-state House and Senate races Texas districts were redrawn in 2012, thus making extending this analysis back a much more complex endeavor. , I began to see if there was a correlation between the competitiveness of a race and the voter turnout rate:
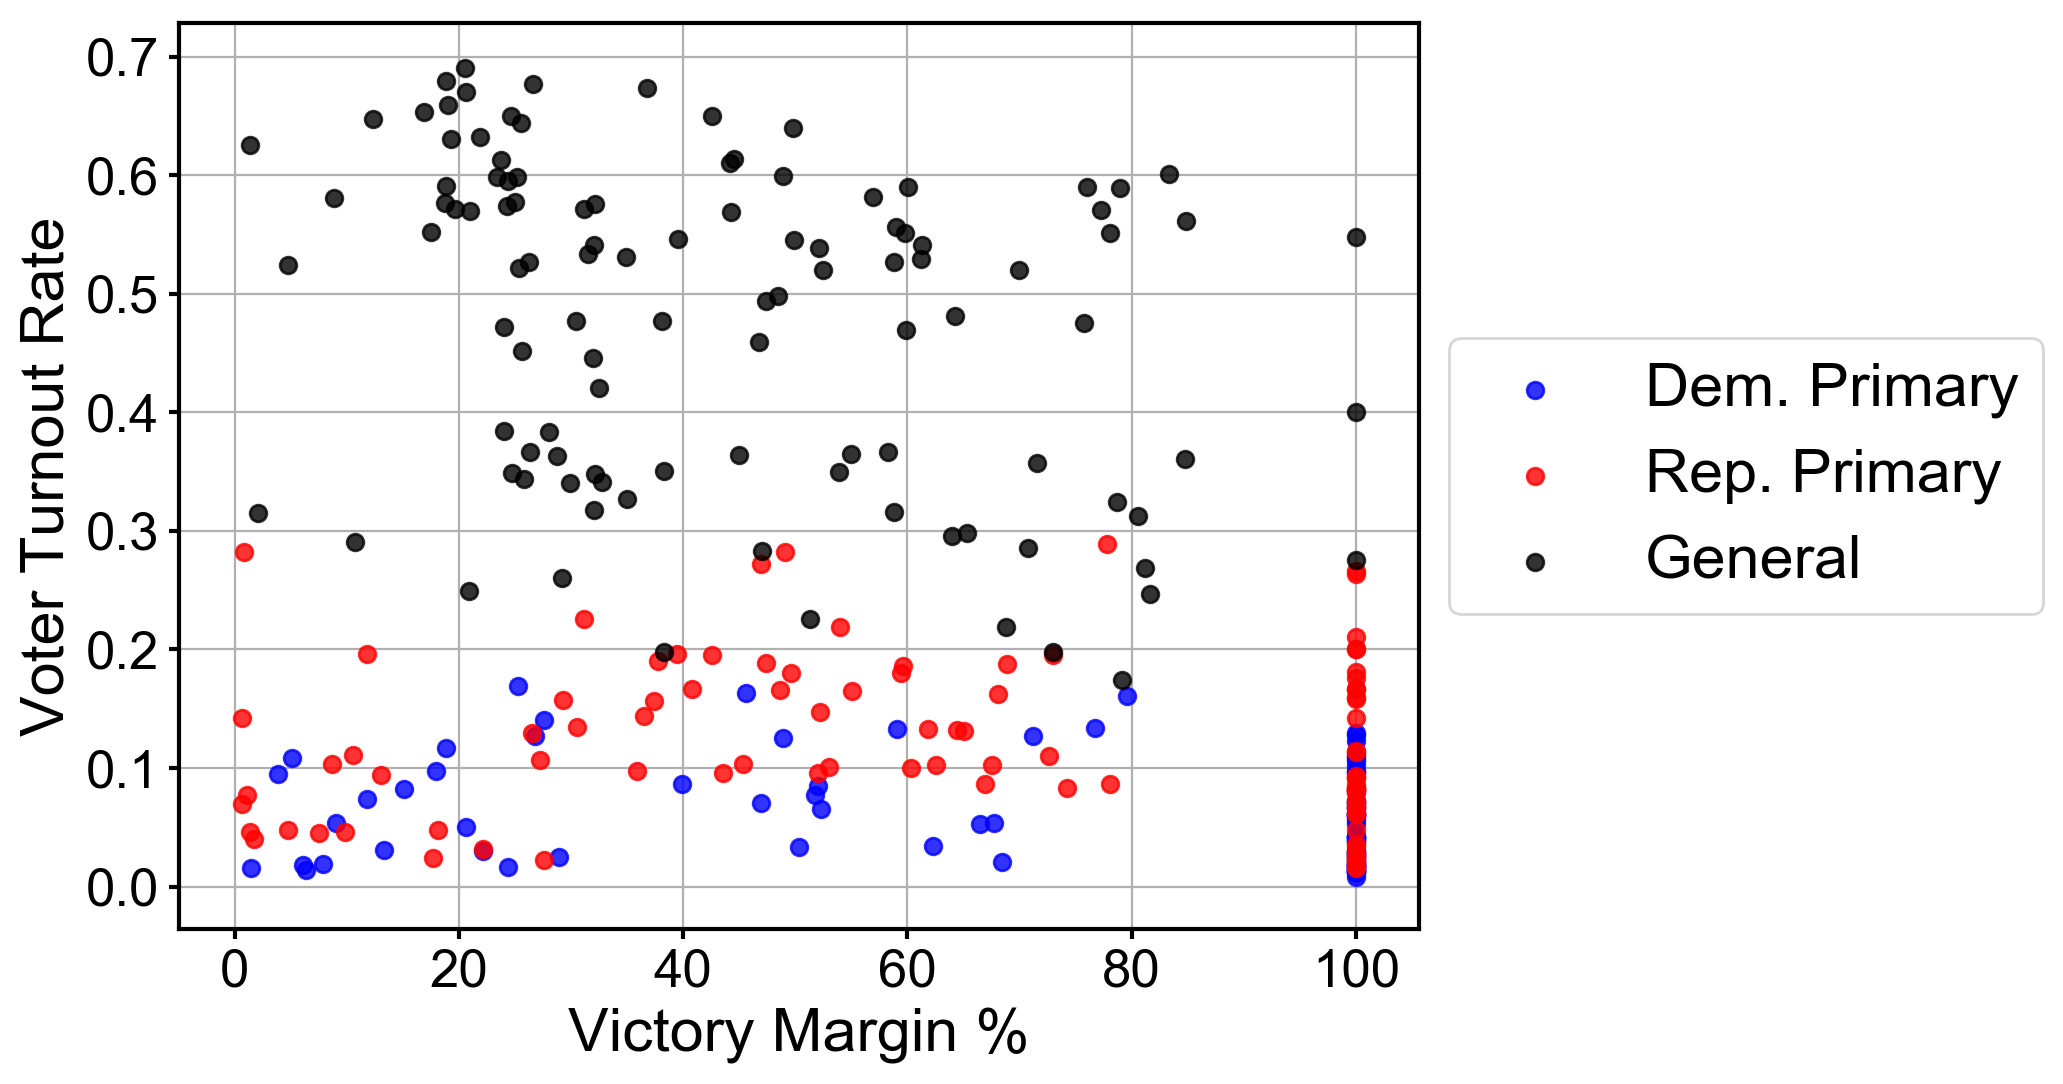
This scatter plot visualizes the voter turnout rate vs. vote margin for different election districts. In this instance, vote margin (which I use as a proxy for competitiveness) is the percent difference of received votes between the race victor and the runner up, such that 0% would be a tie, and 100% is an uncontested race. There doesn’t seem to be much of a correlation, which came as a surprise: I had expected close, competitive races to attract more people to the polls in a particular district.
However, districts with varied demographics (age distribution, income, density, etc.) were likely to have overall base voter turnout levels which may muddy the above analysis. I then took the districts which had the largest changes in voter turnout rates to see if I could isolate what caused the change. Here is the voter turnout change between the 2012 and 2016 general election based on the competiveness of the equivalent 2012 election:
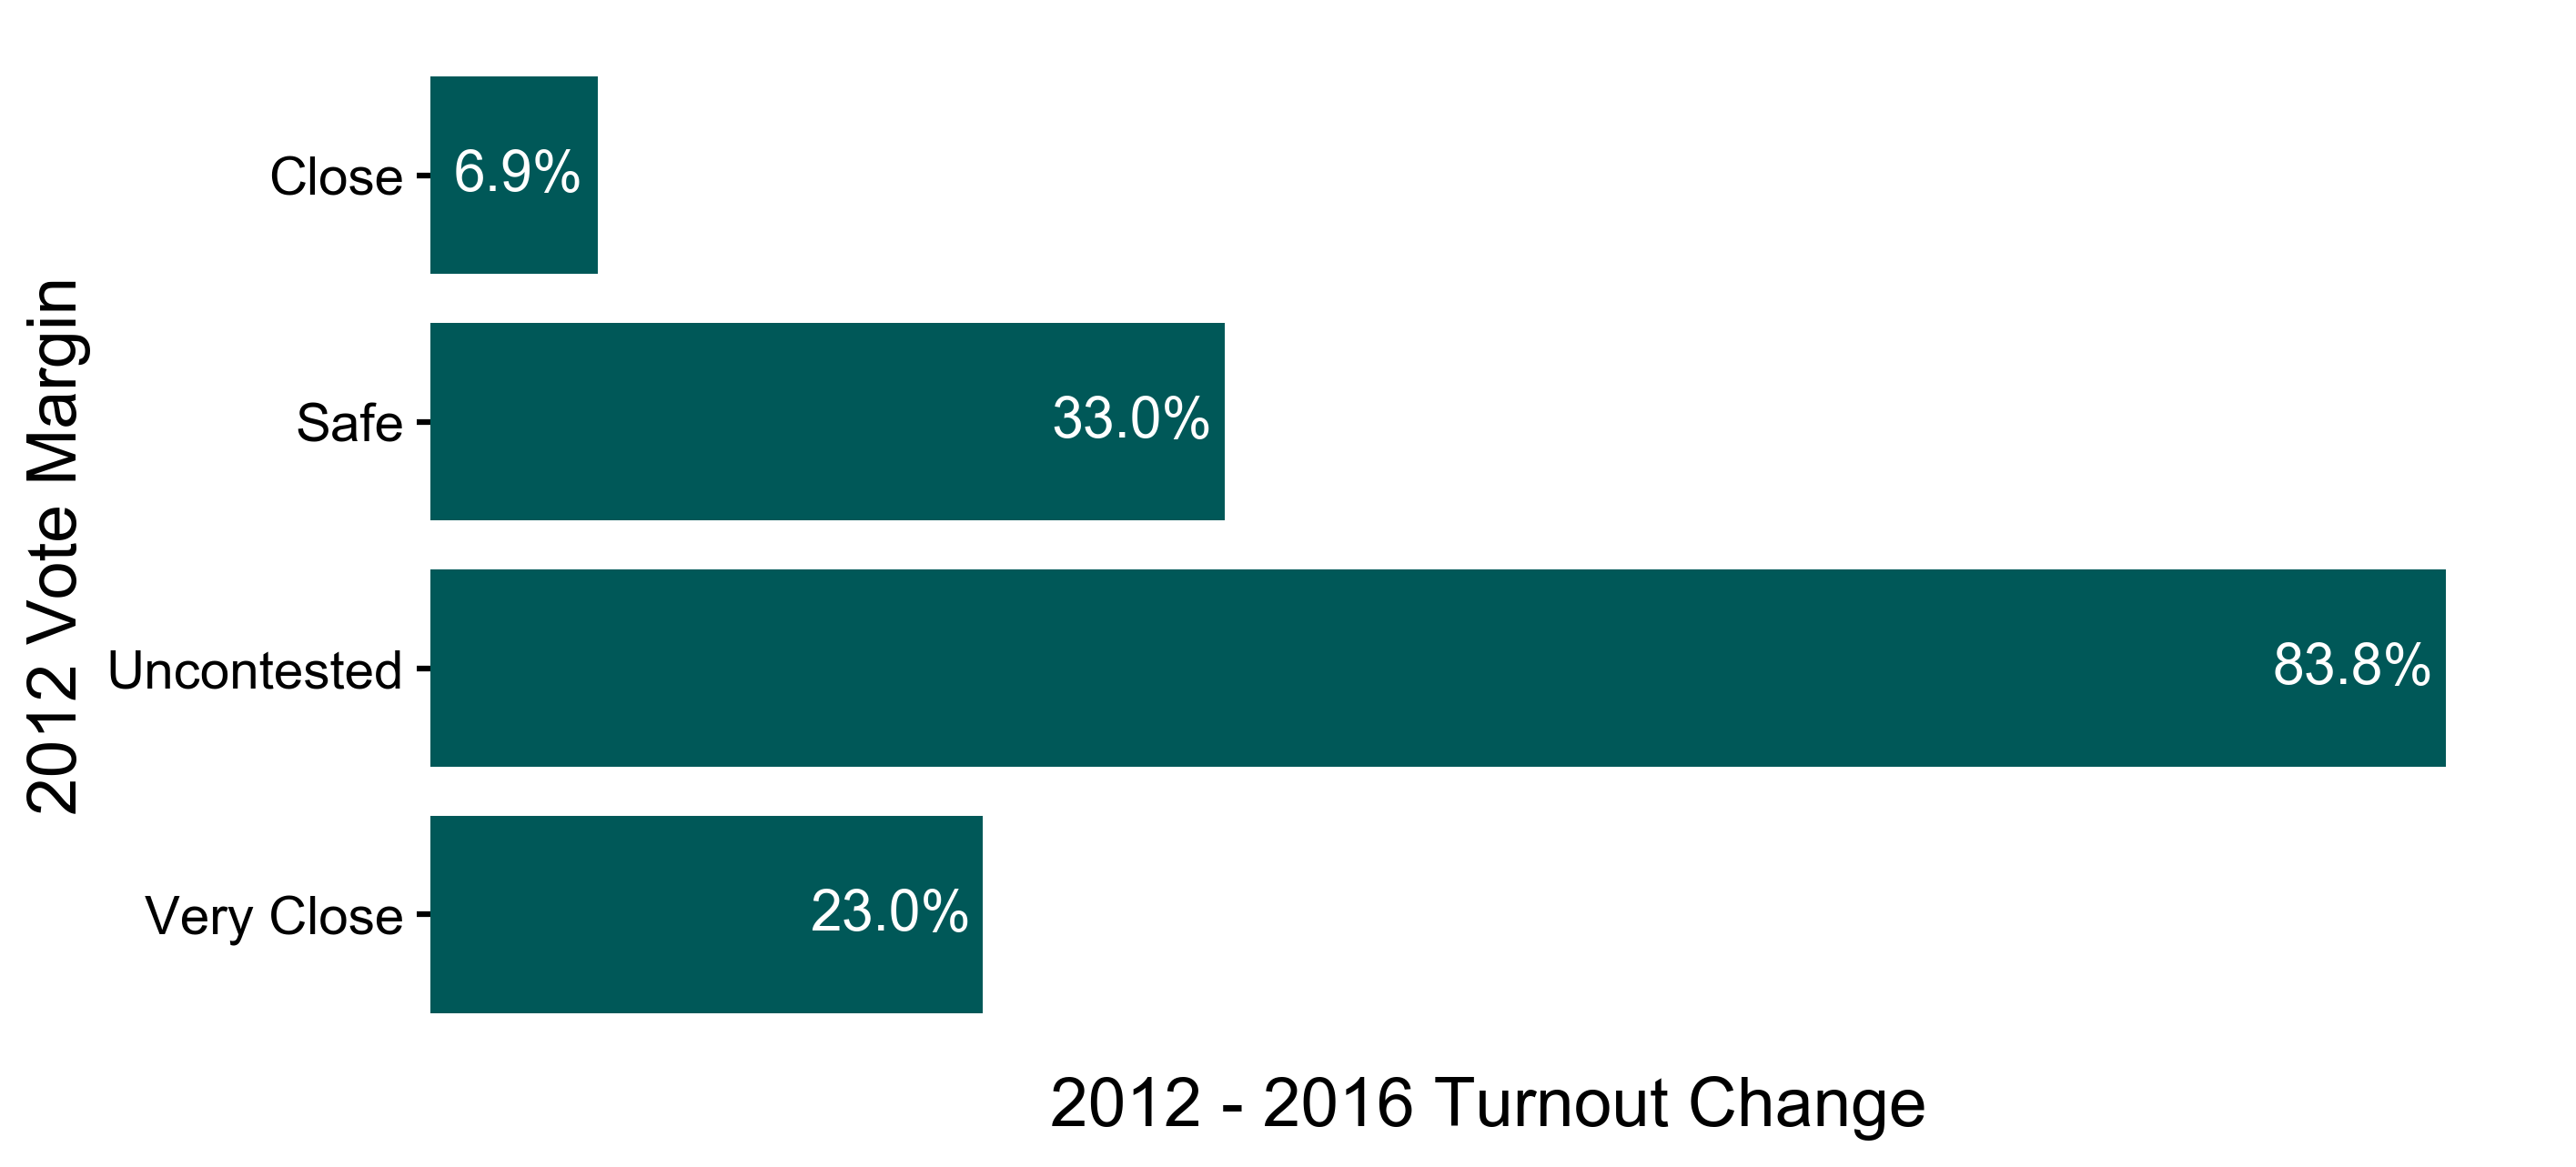
Uncontested 2012 races see a 2012→2016 voter increase which is 55% greater than non-uncontested races in 2016. One may understand this as follows: uncontested seats in a given year have a significantly higher chance of becoming contested by a serious candidate the following election year. These new candidates, seeing a potential opening, conduct widespread campaigns, spend more money on average, and thus produce a surge in the number of votes cast.
While this relationship is noisy, from this starting point I was able to build a regression model, predicting the change in the voter turnout rate from the previous voter turnout margin and a number of other features (number of candidates, previous total votes cast, etc.). After feature scaling, a 2nd degree polynomial model fit the held-out test data the best. The overall R^2 for the fit is 0.48 — given the range of complex political and societal factors which likely impact the voter turnout rate, it is surprising that such a simple model is able to, loosely speaking, explain 48% of the variance.
From Value Voting's business perspective, the most interesting metric is how much better, or worse, this model preforms compared with their preexisting model where voter turnout rates are assumed to be static --- we will express this in terms of the total vote error. Restricting ourself to the 2016 Texas State House and Senate primary races, the static model misclassified 1.97 million voters, while the model here reduced this misclassification by 290,000 people to 1.68 million voters. Given there were a total of 4.1 million votes in these elections, my model represents an improvement of roughly 7%.
Afterthoughts
One of the key difficulties in this project, or any predictive analysis using election data, is the human factor. People are finicky creatures, and frequently make choices on whims, often inconsistently compared with their past behaviors. Elections and attitudes towards them, too, are complex beasts. Perhaps a certain candidate’s message (or lack thereof) causes a surge in interest & enthusiasm. Or a wealthy donor decides to flip a race and buys significant airtime. Or a certain county reduces the number of polling stations. Biggest takeaway: predicting elections and human behavior is a difficult data science task, fraught with uncertainties based around constantly shifting political ideas and attitudes. Indeed, if the most recent general election was any indication, predictions can be, unfortunately, very wrong. In spite of the challenges, I have built models based both on the demographics of an electorate, and features specific to elections, which are able to do a, and, hopefully bring some business value to Value Voting. The ultimate tests of these models can't be done yet, sadly, because the ground truth does not exist yet --- we've got to wait until 2018 and beyond.
Given more time, it would be interesting to understand & quantify the broader political factors which directly impact voter turnout rates. As a concrete example, the 2010 midterm election after President Obama’s election saw voter turnout rates surge among registered republicans, particularly in primary contests. This is generally understood as due to the rise of the Tea Party movement and backlash towards Obama’s fiscal policies. Using this as a rough guide, it seems safe to say voter turnout rates, particularly among democrats, will similarly surge in the 2018 midterm elections, with voters electrified in opposition to Donald Trump’s unique blend of populism and crass. The models I presented above are not designed to detect such a surge. However, it seems likely that by utilizing some combination of polling data, text-mining, and sentiment analysis of Tweets, Facebook posts, news articles, etc., data science could understand these overt political trends, and perhaps eventually exceed the foresight of even the most astute political observers.
Contact
Feel free to reach out to Chalence at: csafranek@gmail.com or here